About the project
Air pollution created by human activities (e.g. transportation and industrial production) or by natural events (e.g. wildfires) has been linked to severe environmental and public health consequences. Climate change, for example, has been at the center of national attention and left unchecked could have profound and irreversible effects on our planet. This report provides a comprehensive analysis of U.S. power plant emissions from 2016 through 2019. We focus on three main pollutant gases emitted through the electricity production process: carbon dioxide (CO2), sulfur dioxide (SO2), and nitrogen oxides (NOx). We consider the relative production of these gases by U.S. power plants and associated environmental concerns.
Global Environmental and Health Problems Related to Air Pollution
Global warming. Global warming, the gradual increase in Earth’s temperature over time, is among our most pressing environmental concerns.
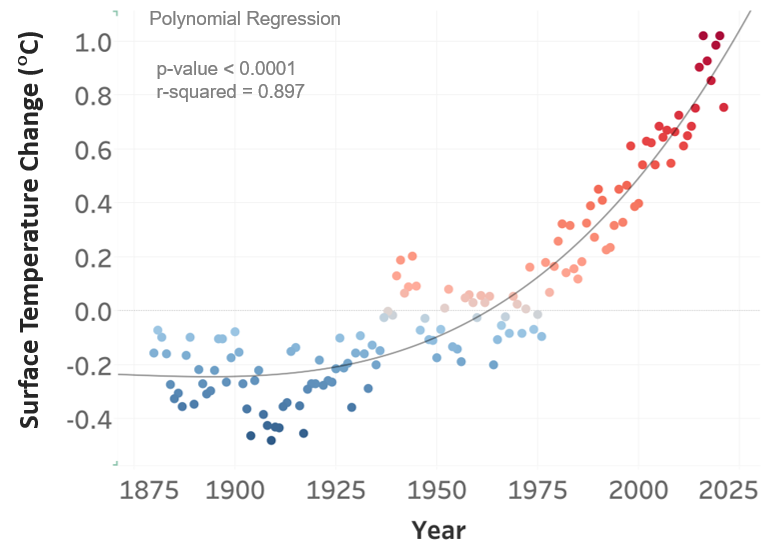
Fig. 1. Earth’s changing surface temperature (1880-2015).
The regression model, based on data from NASA [1], indicates that Earth’s surface temperature is rising exponentially (Fig 1). Whereas between 1875 and 1925 the surface temperature of Earth was stable (flat trend line), the surface temperature rose dramatically after 1925 (steep trend line). In the last 80 years, the Earth's surface temperature increased about 1 degree Celsius.
The global warming phenomenon is generally attributed to the greenhouse effect caused by increased levels of carbon dioxide (CO2), methane (CH4), nitrous oxide (N2O) and other pollutants that trap heat in the atmosphere. The main sources of greenhouse gases are presented below (Fig 2). Transportation, electricity and industry contribute significantly to greenhouse gases production. Theorized consequences of its production include rising global temperatures and sea levels and increased risk of severe climate events (e.g. droughts, abnormally intense storms).
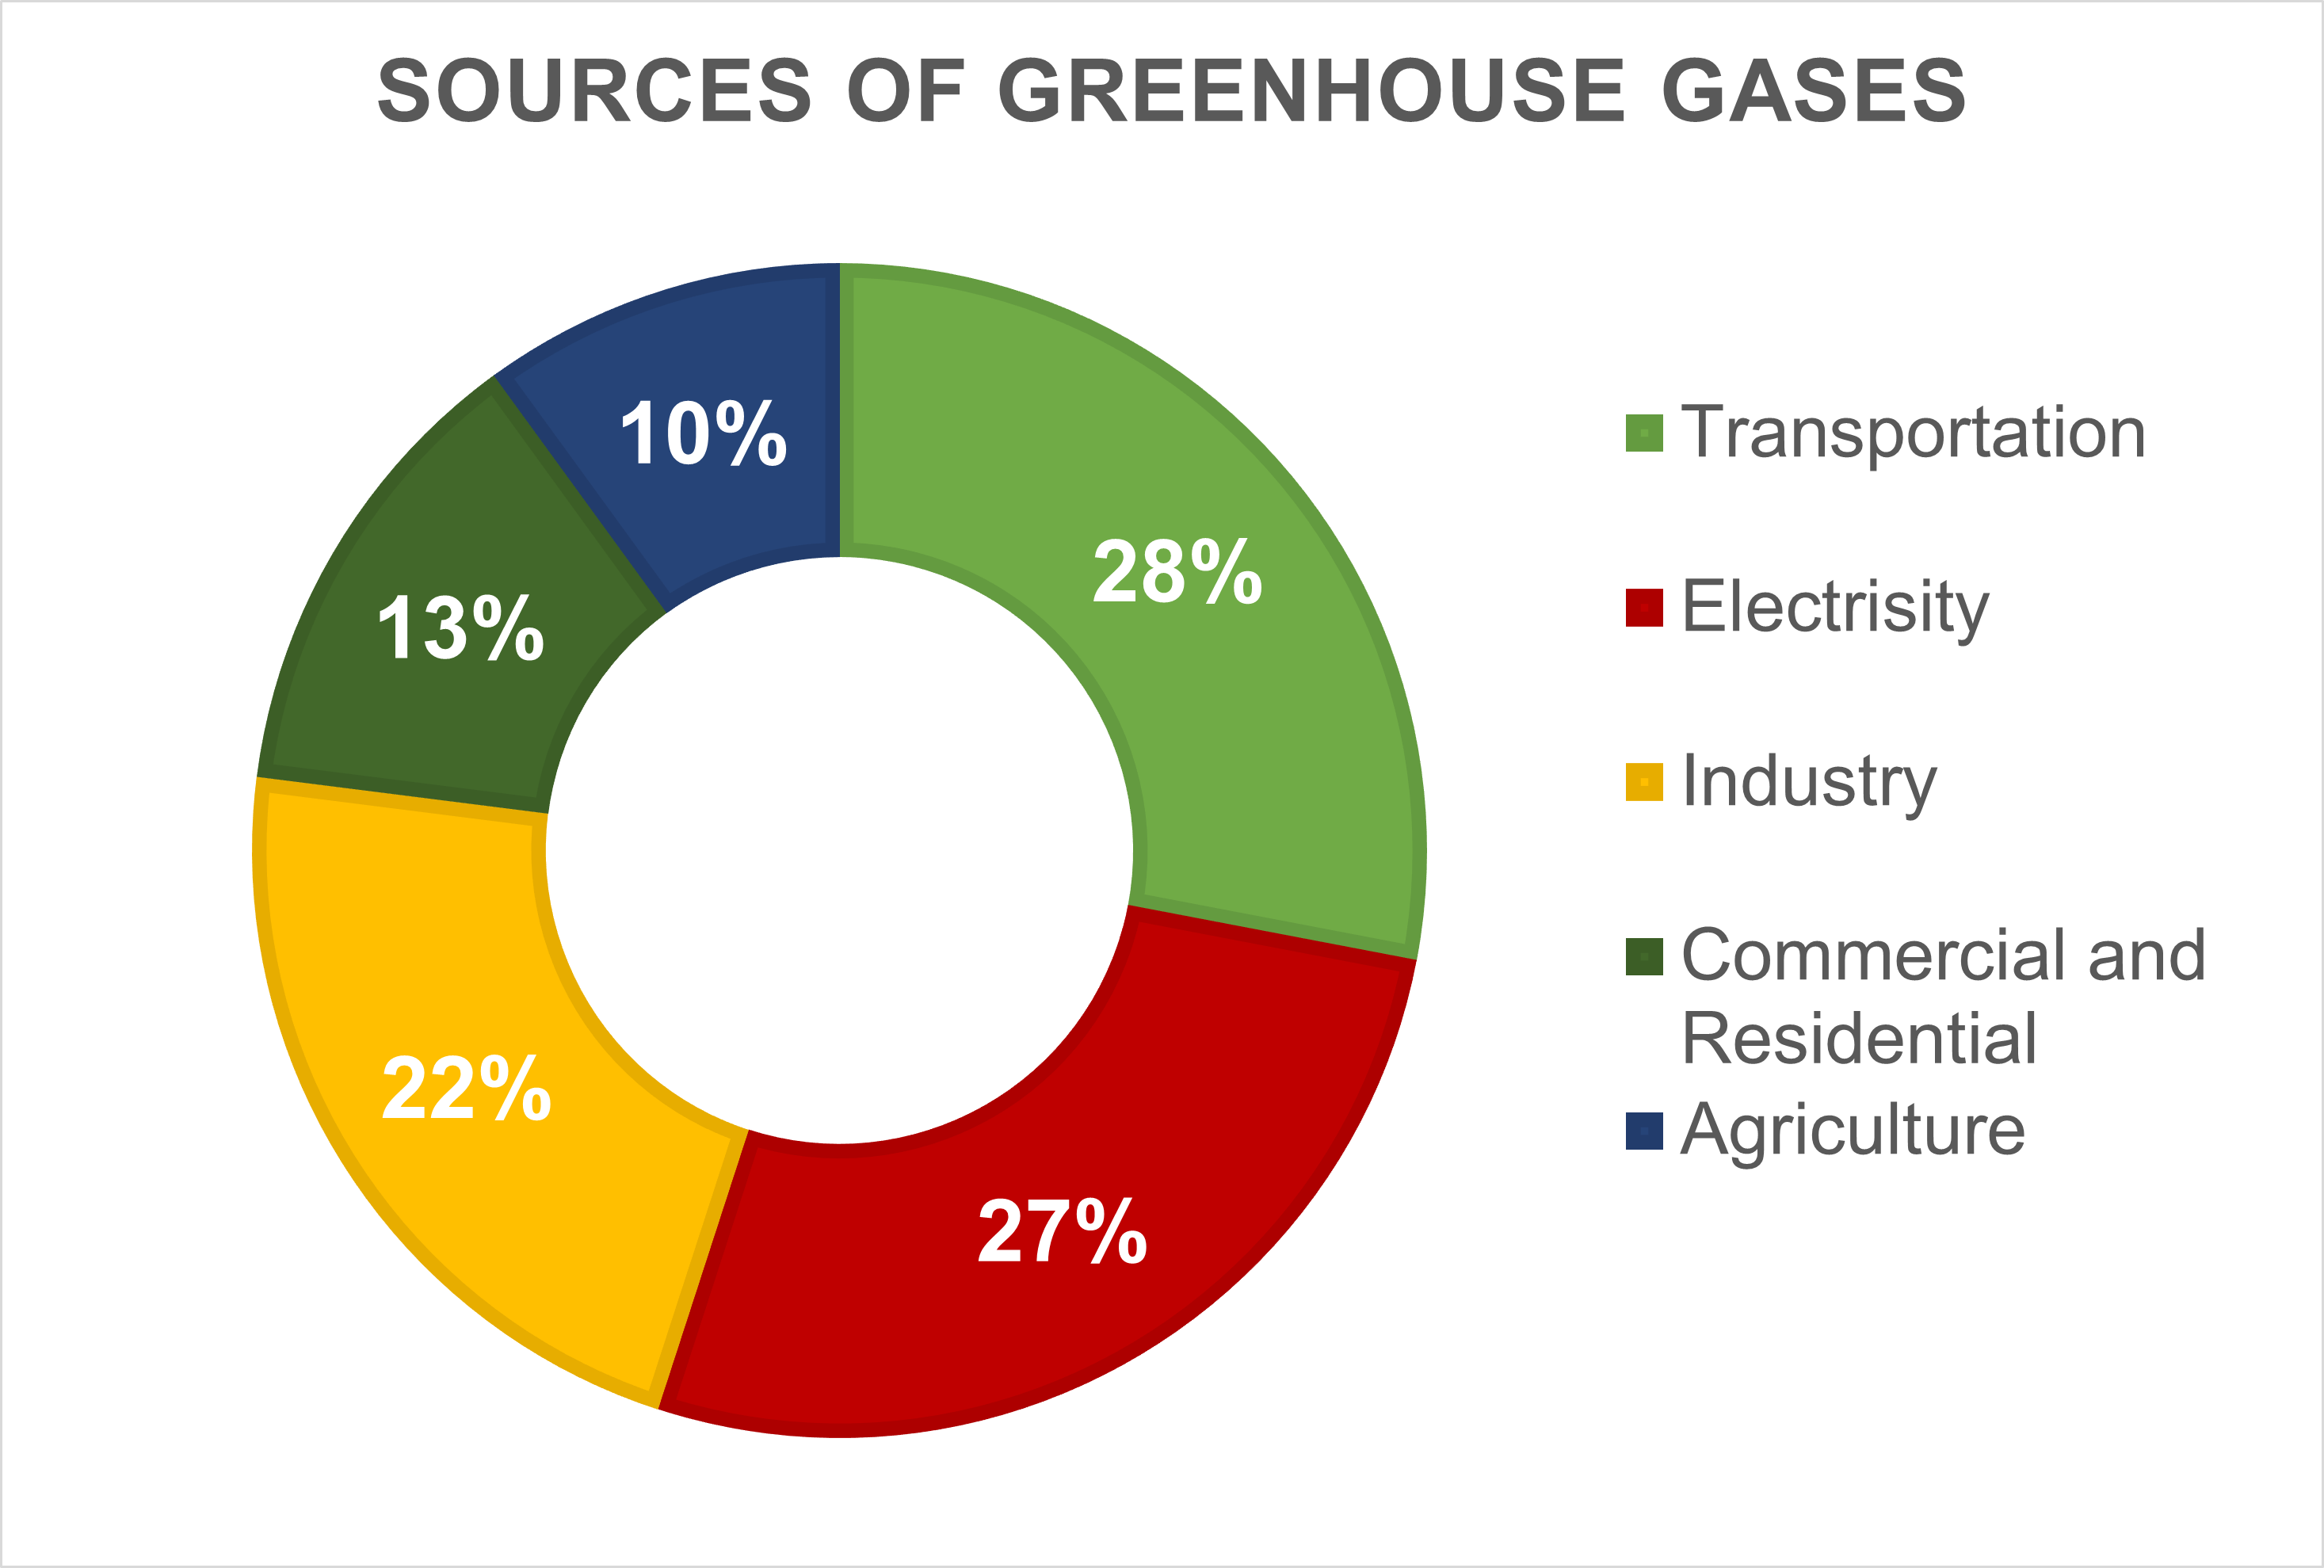
Fig. 2. Sources of contribution (%) to greenhouse gases.
Acid Rains. Another critical environmental problem is acid rain and related events (e.g. acid snow, fog or hail). This phenomenon can severely endanger forests and plants. Acid rain occurs when sulfur dioxide (SO2) and nitrogen oxides (NOx) are released into the atmosphere. Then gases SO2 and NOx react with water, oxygen, and other chemicals to form sulfuric and nitric acids. Formed acids seep into the ground and interfere with trees’ absorption of nutrients, such as magnesium and calcium.
Public health. SO2 and NOx can combine with other molecules in the atmosphere to form small, acidic particulates (components of smog) that can be harmful to human health. They can damage human lung tissue leading to asthma, bronchitis, and cancer. These oxides (CO2, SO2 and NOx) are the main fossil fuel combustion products and emissions are closely monitored and recorded in databases.
Data Collection (databases)
U.S. electric powerplant data, used for this 2016-2019 analysis, is derived from the US Energy Information Administration (EIA) and report type of fuel [2], amounts of fuel used, and quantity of energy generated (both monthly and annually) [3], geographical location of power plants (latitude and longitude) [4], fuel codes, emission data per fossil type of fuels [5], [6].
Data Preprocessing
We obtained primary EIA data (Excel spreadsheets and CSV databases) that was subsequently prepared for analysis. This preparation included:
- selecting relevant information,
- cleaning (for example, only power plant with the annual amount of generated electricity (MWh) > 0 were considered),
- merging relational databases.
Pandas and Tableau were used for these analyses.
US Electric Power Plants
This chapter covers the various types of electric power plants in the U.S., their quantity, location, efficiency, and emissions. Common types of power plants include:
- Fossil Fuel – coal, petroleum and natural gas.
- Nuclear Fuels – nuclear energy.
- Renewable Fuels – water at a conventional hydroelectric turbine, solar, wind, geothermal, wood waste, biogenic solid waste etc.
- Other - non-biogenic solid waste, tire-derived fuels, hydroelectric pumped storage etc.
In 2019, there were around 10,000 electric power plants in the United States with significant variability in electricity generation according to plant type (Fig. 3)
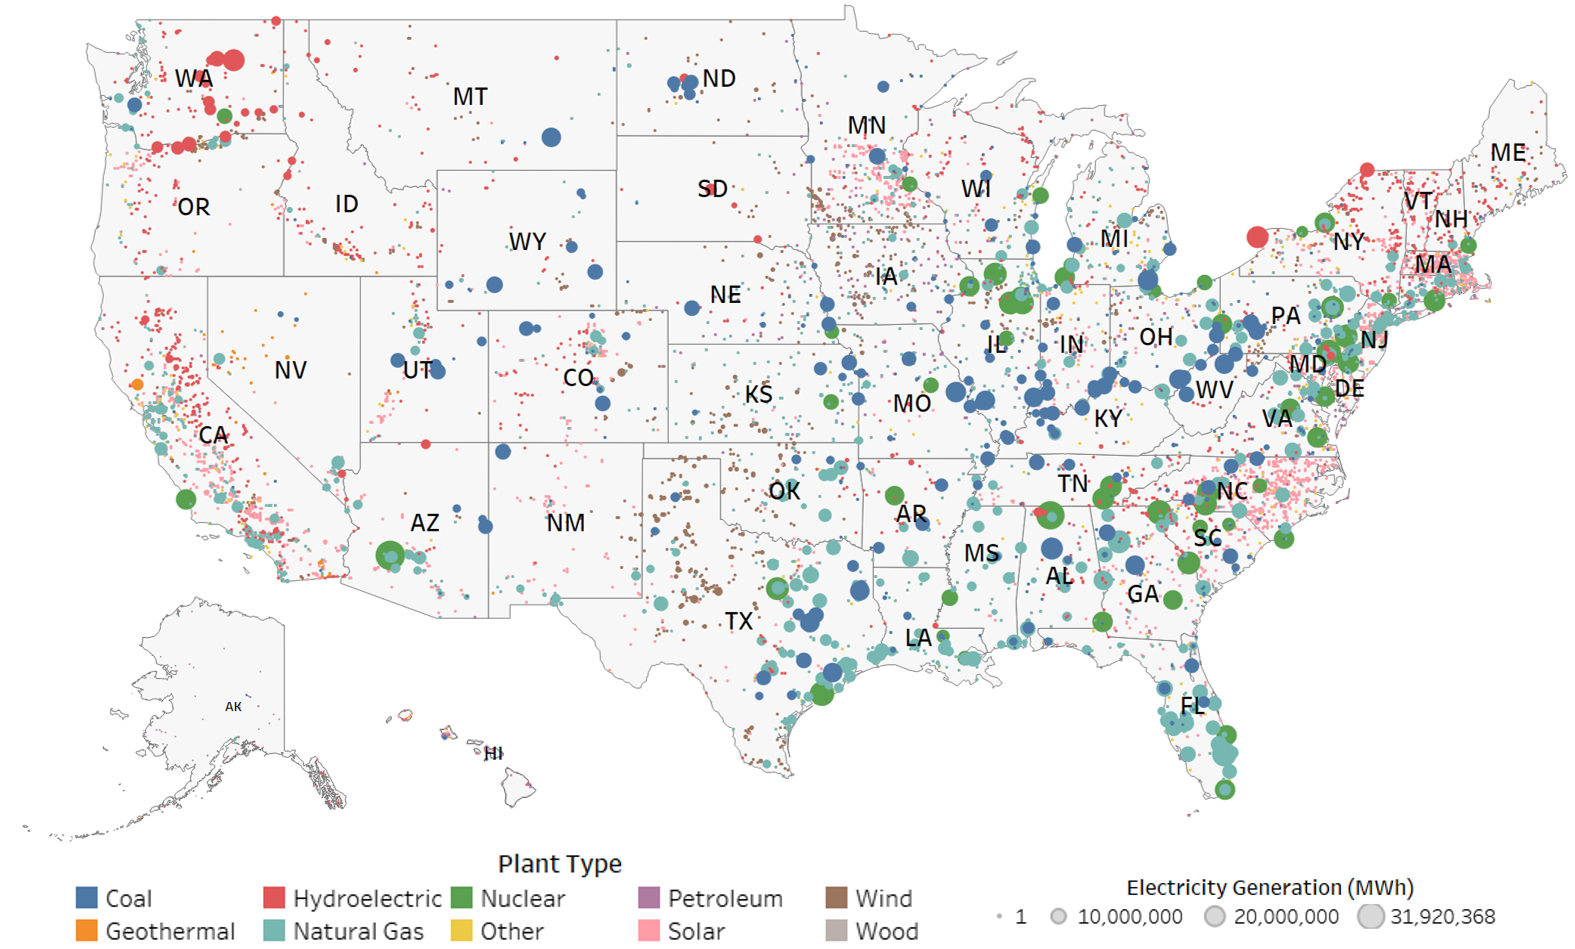
Fig. 3. Map of Electric Power Plants (US, 2019).
Results were also stratified by state (Fig. 4). Texas is a leader in electricity production in the US, producing around 500 million MWh of electricity in 2019, largely from natural gas plants.
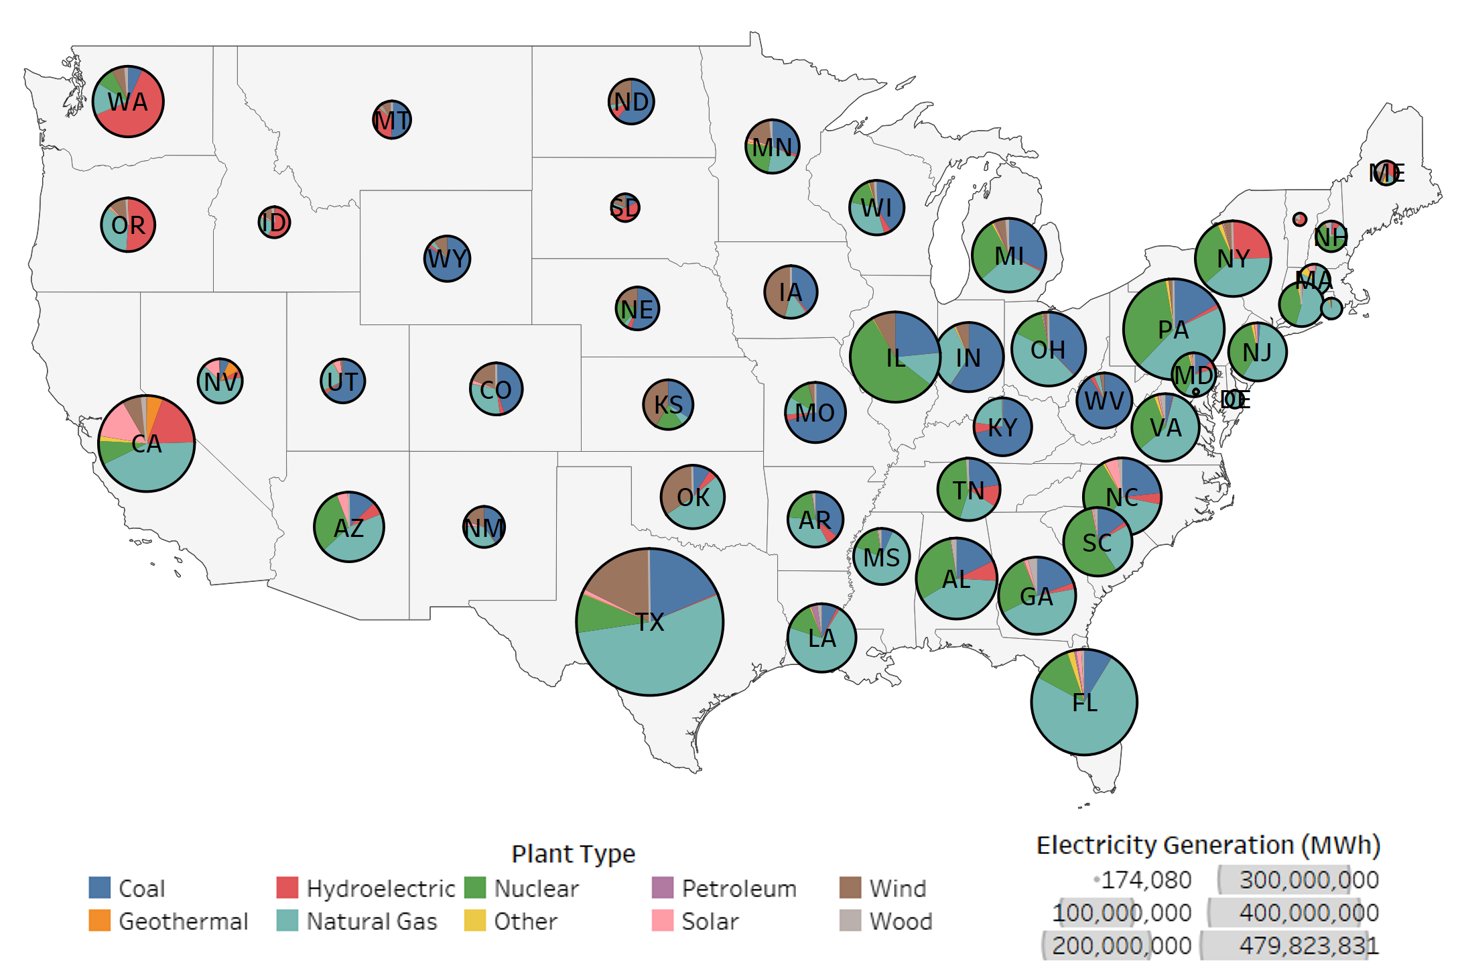
Fig. 4. Composition of every power plant and amount of generated energy.
U.S. states produce a considerable amount of electricity from fossil fuel and nuclear plants. However, there are clear regional differences in alternative energy production. U.S. power plants can be essentially divided into three regions:
- Western U.S. – primarily hydroelectric, solar, wind, and geothermal power plants. For instance, in California 14% of the total amount of electricity was generated by solar power plants in 2019, the highest in the United States. In Washington and Oregon, hydroelectric power plants are more popular.
- Central U.S. – Significant use of wind power. Iowa, Oklahoma, and Kansas generated about 40% of their energy from wind power plants (around 25 million MWh of electricity in 2019), while Texas contributed most significantly to wind energy production (84 million MWh of electricity).
- Eastern U.S. – uses far fewer hydroelectric and solar power plants. In this region, electricity is generated mainly by fossil and nuclear power plants. (Except for New York, where hydroelectric stations produce 25% of their electricity).
In 2019, the US produced around 4 billion MWh of electricity. Natural gas and coal contributed 62% of total energy production during this time (Fig 5). Nuclear energy power plants also contributed 19%, while hydroelectric, solar and wind provided only 16% of energy.
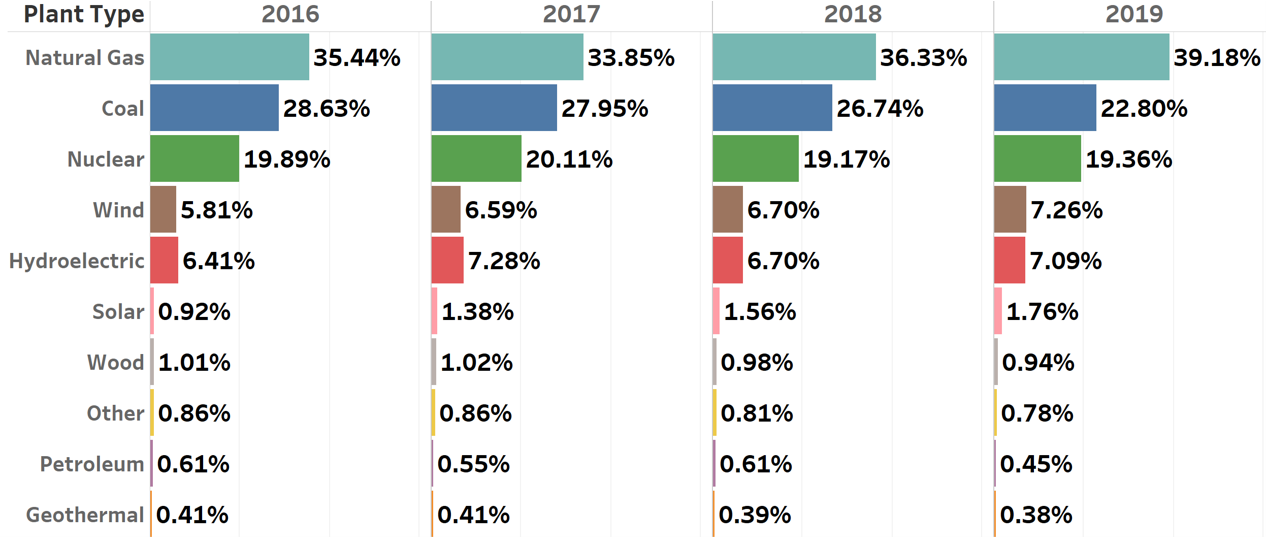
Fig. 5. Energy generation (in % of total) 2016 - 2019.
In other words, fossil fuel (petroleum, natural gas and coal) powerplant stations provide most of the electricity in the U.S. To better understand the environmental impact of fossil fuel power stations, the analysis of these power plants' emission data (CO2, SO2 and NOx) was performed and discussed below.
Fossil Electric Power Plants
State emissions data for CO2, SO2 and NOx between 2016 and 2019 is presented below (Fig 6). Texas was the lead contributor of emissions for all three gases.
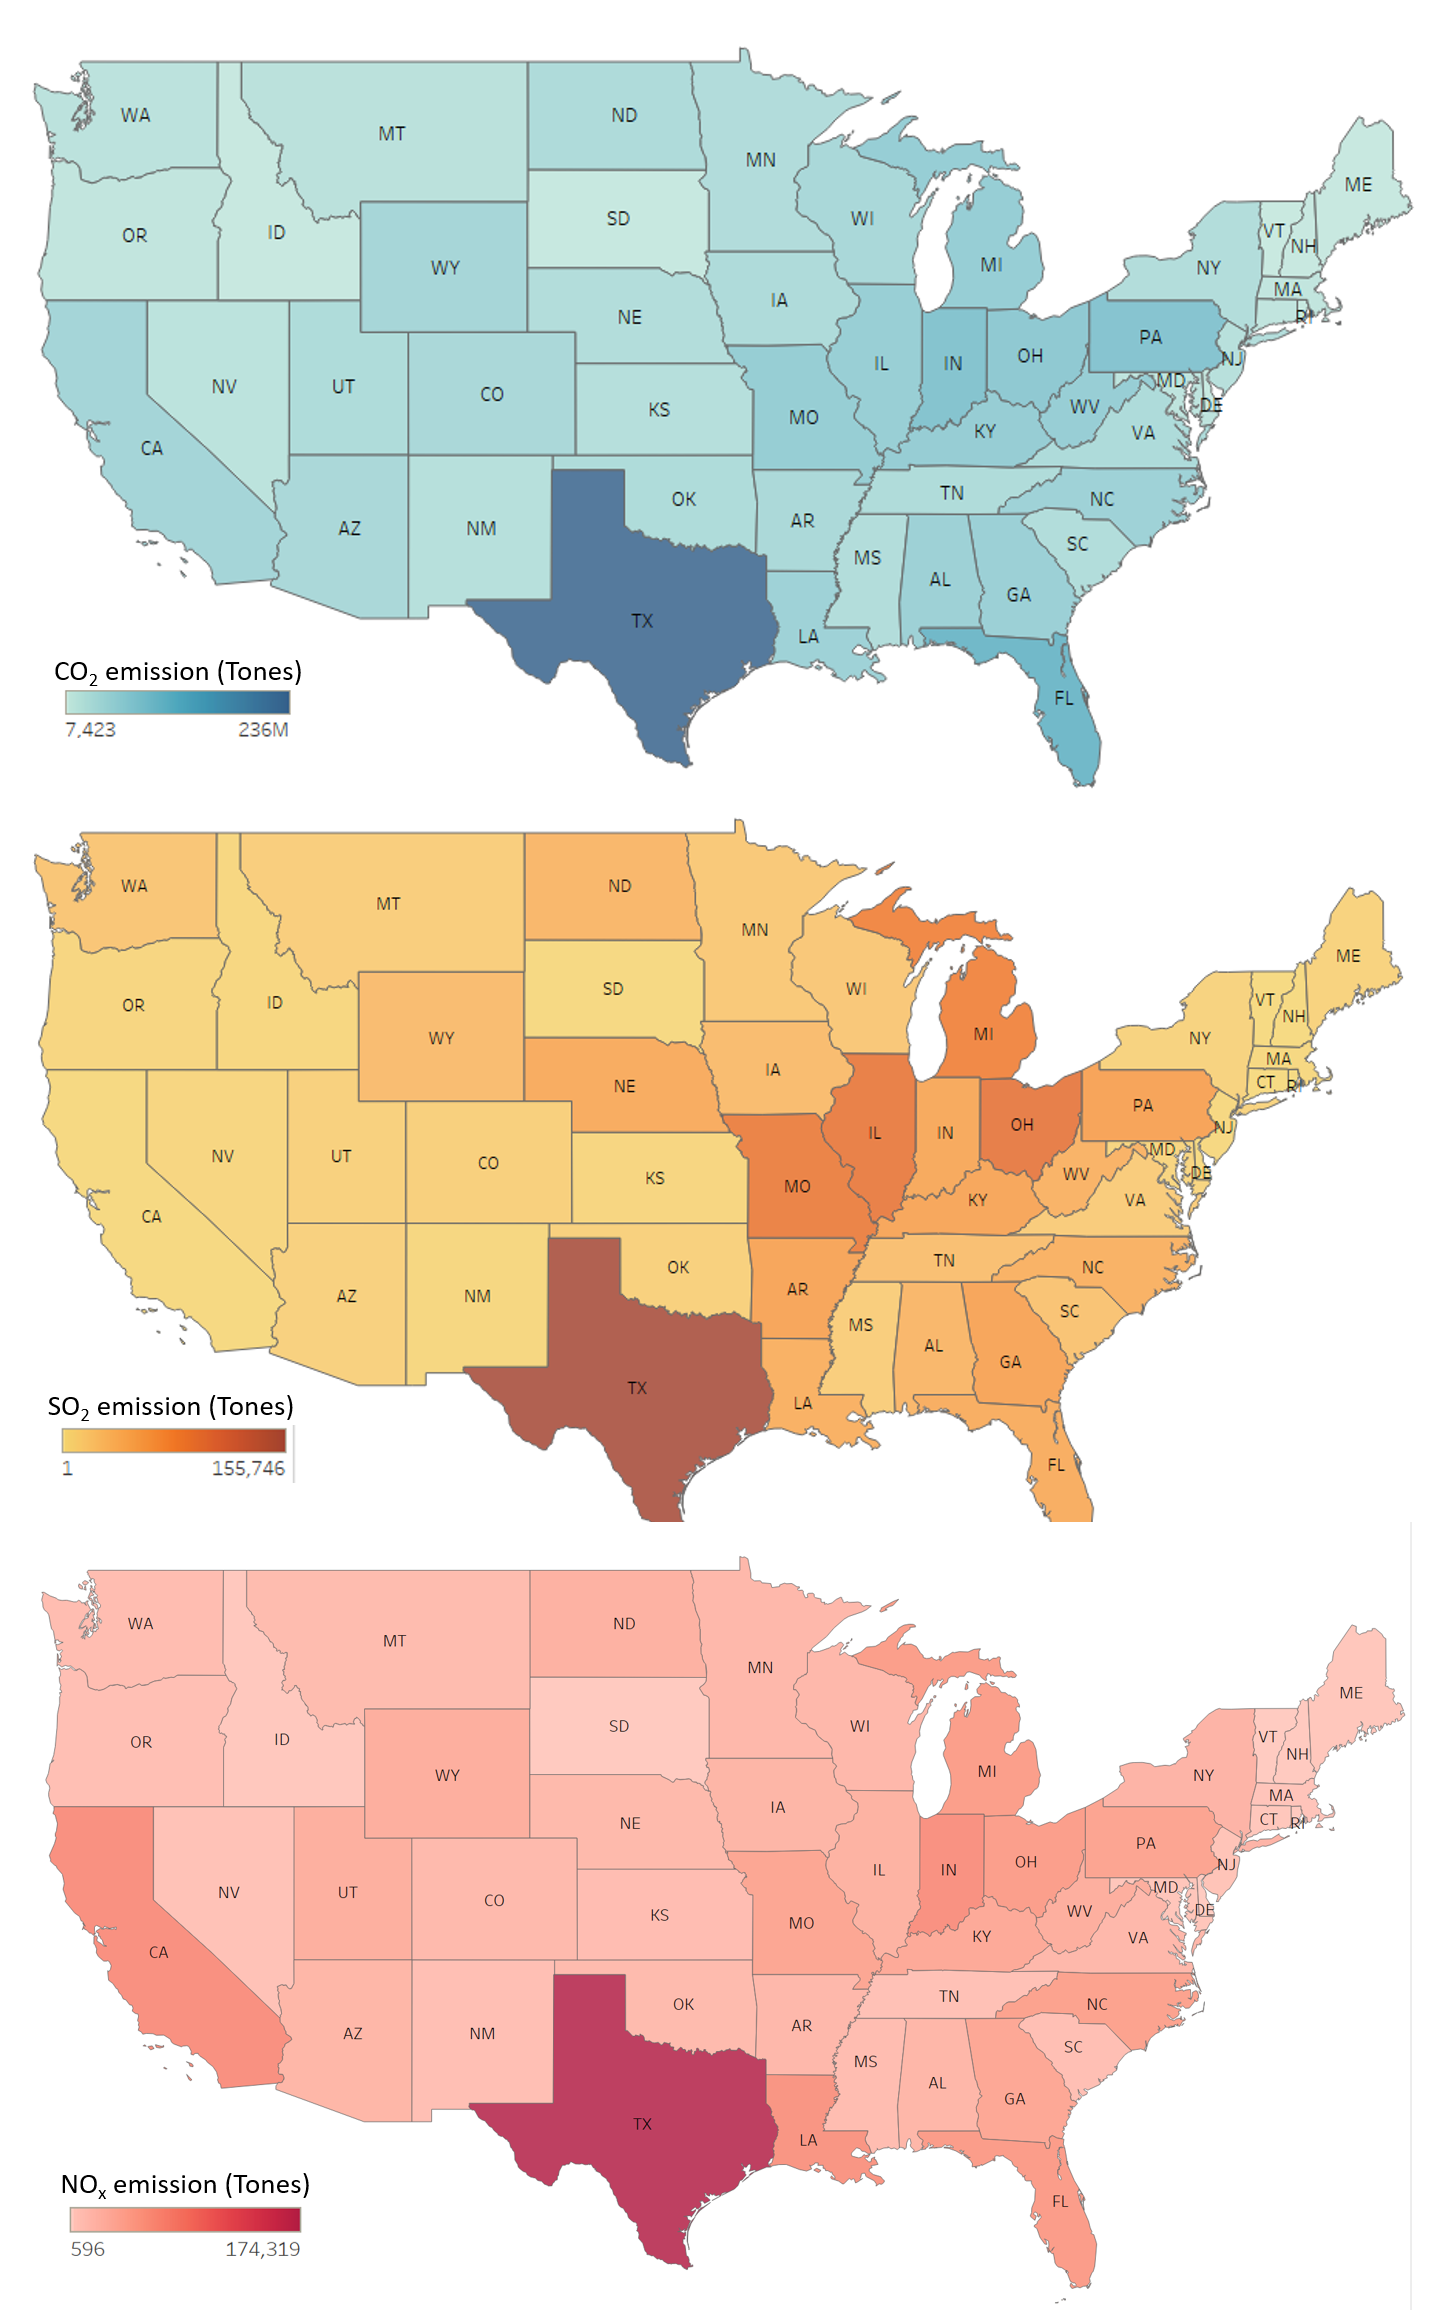
Fig. 6. Amount (Tones) of emitted air pollutants by state in 2019.
Natural gas and coal were the primary fossil fuels consumed in 2019, while petroleum comprised just 1% of fossil fuel consumption (Fig. 7). C Coal power plants were a clear contributor that to the emissions of pollutant gases (Fig. 7).

Fig. 7. Relative fossil fuel consumption (%) in 2019 and their contribution (%) to CO2, SO2 and NOx emissions.
To determine the efficiency of different fossil fuels, energy generation and emission rates of CO2, SO2 and NOx per unit of the fuel were calculated (Table 1). Based on these calculations, natural gas generates 1.5 and 1.3 times more energy per unit of fuel than coal and petroleum, respectively. Coal and petroleum emit nearly twice as much CO2 as natural gas. Therefore, natural gas is the more efficient fossil fuel and is associated with fewer emissions. Petroleum, on the other hand, is low-efficiency and high-emission.
Table 1. Efficiency of fossil fules: energy generation and emission of CO2, SO2 and NOx per unit of the fuel.
| Fuel Type | Energy (kWh) / 1 MMBtu of fuel | CO2 (tones) / 1 MMBtu of fuel | SO2 (tones) / 1 MMBtu of fuel | NOx (tones) / 1 MMBtu of fuel |
|---|---|---|---|---|
| Gas | 120 | 0.06 | 0.03×10⁻⁵ | 3.46×10⁻⁵ |
| Coal | 93 | 0.10 | 10.14×10⁻⁵ | 6.77×10⁻⁵ |
| Petrolium | 79 | 0.10 | 36.43×10⁻⁵ | 17.05×10⁻⁵ |
The most significant growth in renewable energy power plants between 2016 and 2019 has been in solar and wind. The renewable share of U.S. energy consumption increased from about12% in 2016 to 16% in 2019 (Fig. 5, 8). The most significant decline in recent years has been coal, which fell 7% between 2016 and 2019.
The analysis data for considered four years 2016-2019 showed that the renewable share of energy consumption in the United States increased from nearly 12% in 2016 to 16% in 2019 (Fig. 5). The greatest growth in renewables over these 4 years has been in solar and wind electricity generation. The most significant decline in recent years has been coal: amount of coal generated energy fell 7% between 2016 and 2019.
Some electric fuels, such as nuclear and hydroelectric, remained relatively stable during this period, with little change in capacity or energy generation.

Fig. 8. Quantity of U.S. electric power plants by plant type and year (2016-2019).
These trends appear to have had a positive effect as the emissions of the air pollutants SO2 and NOx have reduced by 23% and 6%, respectively during this time (Fig. 9). The emission of carbon dioxide (CO2) remains relatively stable.
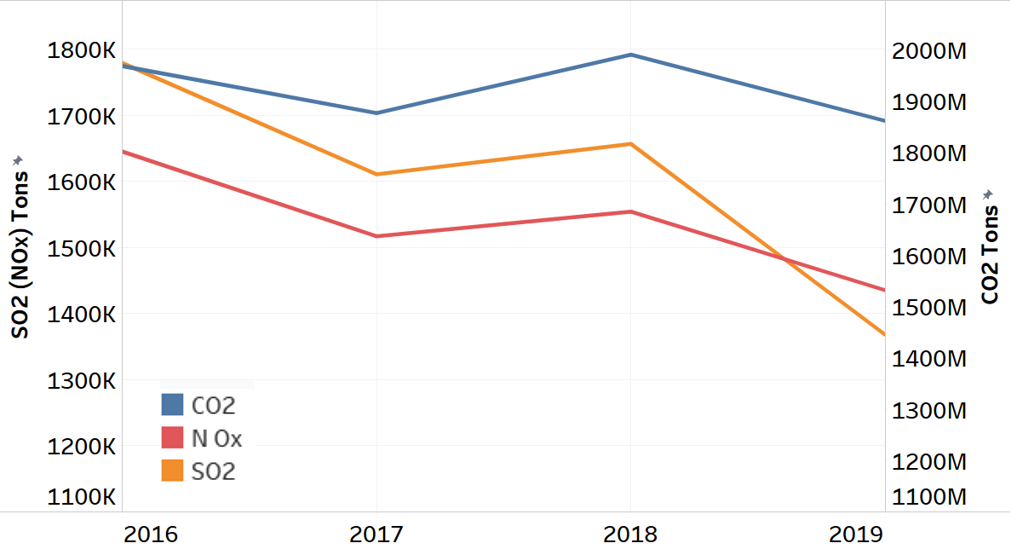
Fig. 9. Emission data of fossil power plants (2016-2019).
Conclusions:
In conclusion, I want to say that electricity is very important part of our lives. In conclusion, recent trends in U.S. power plant energy production represent increased national concern regarding air pollution and climate change. The relative percentage of green fuel power plants is expected to grow, insofar as the energy needs of the United States can be met.